FusionChartsCompareZoomLineDy
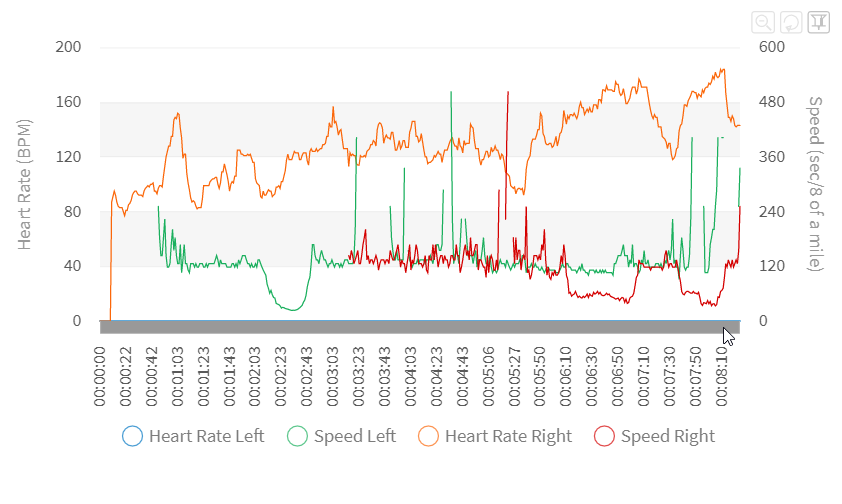
The fusion-realtime-compare-chart component is a Vue component that renders a FusionCharts chart with two sets of data (heart rate and speed) for two separate entities. It supports real-time data streaming, zooming, and a right-side inverted Y-axis.
Props
| Name | Type | Default | Description |
|---|---|---|---|
width | String/Number | '100%' | The width of the chart container. |
height | String/Number | 400 | The height of the chart container. |
caption | String | '' | The main title of the chart. |
subcaption | String | '' | The subtitle of the chart. |
initial_data | Object | null | The initial data for the chart. |
new_data | String | null | The new data to be added to the chart. |
speed_unit | String | 'km/hr' | The unit used for speed measurements. |
num_display_sets | Number/String | 300 | The number of data sets to display at once. |
invert_right_y_axis | Boolean | false | Whether to invert the Y-axis on the right side of the chart. |
heart_rate_1 | String | The heart rate data for the left entity. | |
speed_1 | String | The speed data for the left entity. | |
heart_rate_2 | String | The heart rate data for the right entity. | |
speed_2 | String | The speed data for the right entity. | |
category | String | The category labels for the chart data. |
Computed Properties
| Name | Type | Description |
|---|---|---|
root | Object | The root state of the Vuex store. |
Data Properties
| Name | Type | Description |
|---|---|---|
chart_config | Object | The configuration object for the FusionCharts chart. |
data_sender | Object | The FusionCharts object for sending data to the chart. |
is_loading | Boolean | Whether the chart is still loading. |
chart | Object | The FusionCharts chart object. |
Events
| Name | Parameters | Description |
|---|---|---|
zoomed | { start: Number, end: Number } | Emits when the user zooms in on the chart. |
Methods
| Name | Description |
|---|---|
onLoad() | Initializes the chart. |
renderChart() | Renders the FusionCharts chart. |
getDataSource() | Gets the data source for the FusionCharts chart. |
Features
OnLoad Configurations
- As soon the the
onLoadmethod is triggered, it sets thedata_sourceusinggetDataSourcemethod that returns the data source as per our requirements. Feel free to check this method out in the component file. - We configure the
rendered,renderCompleteandrealTimeUpdateCompletemethod as per our requirements
Update Realtime values
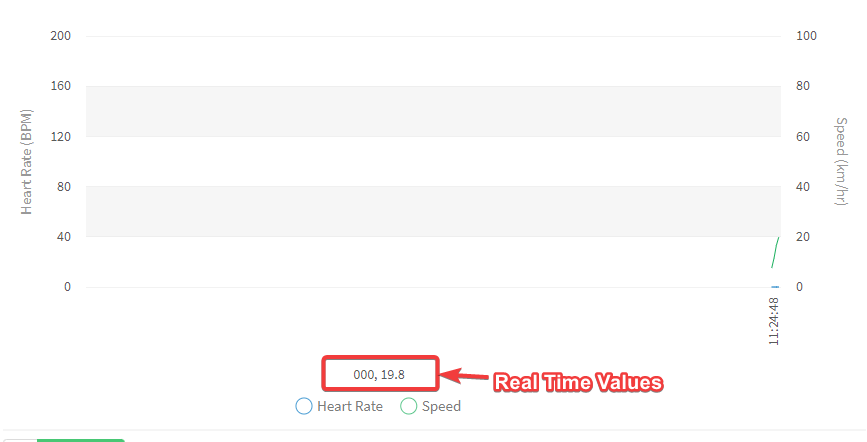
Due to the limitations in FusionCharts we cannot change the format or value in the realtime values displayed at the
bottom. So to achieve what we need, we have made few tweaks of our own.
- The
setRealTimeValuesis called in therealTimeUpdateCompletelistener. This ensures that the desired svg component loaded to DOM. - It will find the desired svg element to be updated.
- Then it modifies and inserts our custom HTML content to get the desired results.
Inverted Y-Axis
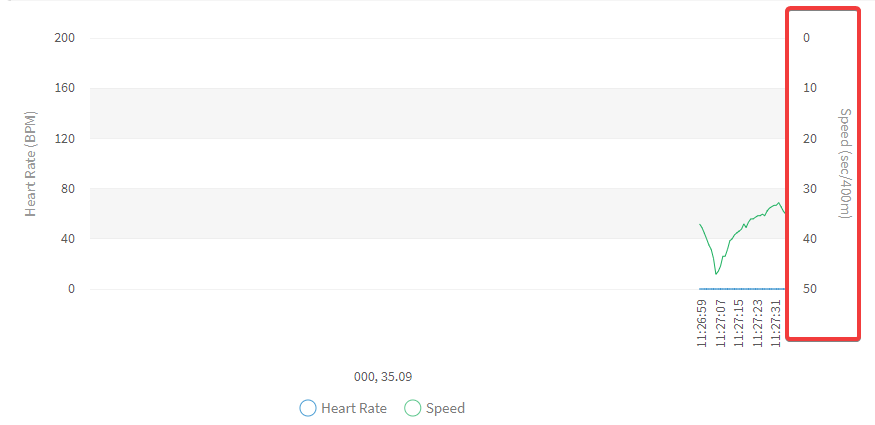
In this project the speed unit can also be in reverse Seconds/Km, Seconds/200m, Seconds/8th of a mile etc,.
When such speed unit is selected the axis representing speed must also be in rendered in reverse. Even though by updating
the configurations, we can achieve the desired effect when the data is not updating. As soon as the realtime data comes
in the inversion does not work.
| Expected | What We Get |
|---|---|
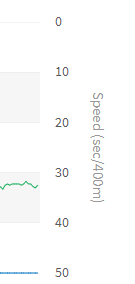 | 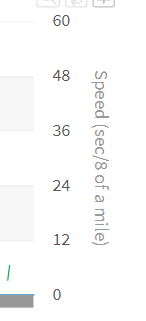 . . |
The solution we came up with is the following:
- If the
invert_right_y_axisis set to true we convert the data to negative numbers, and pass it via props - The
onLoadmethod calls therenderChartmethod - In the
renderChartmethod event listener is applied torealTimeUpdateCompleteevent - In
realTimeUpdateCompleteevent listener if the propinvert_right_y_axisis set to true, thensetInvertedRightYAxisis called. setInvertedRightYAxismethod will identiy the y-axis texts and replace the individual texts to positive numbers, since the data was in negative already we get the axis in opposite direction and the chart also renders according to that logic only.